For my final blog of the semester, I’ll aim to apply and synthesize everything I have learned into one exercise – video processing. What is video processing? A video is basically a series of images taken in quick succession. Hence, video processing is just image processing done on multiple time-related images.
In this activity, my partner, Julia Negre, and I aim to verify conservation of energy in a coupled pendulum system (see diagram below).
Schematic diagram of a coupled pendulum
It’s basically two simple pendulums tied to a taut string. It is key that the oscillations be restricted to the axis perpendicular to the pendula’s separation.
Due to numerous applications of the Fourier Transform in signal processing (to be discussed soon!), the image processing student should familiarize himself with the general properties of the transformation.
In this blog, the following properties will be discussed: anamorphic, rotational and convolution properties.
Let’s say you’re given a very messy and clutter picture. For simplicity’s sake, let’s say it’s also a binary image. How would you clean it? Sure, you could go to paint and manually and tediously erase all undesired parts. But what if you had 1,000 of these images? No one would have the patience to manually clean all these images. So what can be done?
Good thing we have – *drumroll please* – Morpological Operations! What are morphological operations? From the name itself, they are processes/operations that work on shapes. One of its applications is in cell-counting, wherein cells are considered as connected blobs, and other shapes, which may be smaller or larger in size, are removed via morphological operations. This blog shall focus on this particular application.
Image processing is highly useful and efficient when used with a large set of images/data. Applications include the tracking of a region of interest(ROI) throughout these frames. However, if user-intervention is required to locate the ROI, it is very tedious and not at all efficient. Hence, the program must be taught how to automatically detect and isolate the ROI. After isolation, image processing techniques and analysis such as centroid-location and cleaning are more easily applied. This procedure of isolating ROI’s in an image is called Image Segmentation.
In this activity, image segmentation will be performed using color histograms. In essence, this method provides the computer with a reference histogram or color (chosen by the user) from one frame, with which it uses to locate similar histograms/colors in the succeeding frames. In this work, the technique shall be applied to only one frame (see below).
Test image for image segmentation. Note the two dominant colors (cyan and red).
Normalized Chromaticity Coordinates (NCC)
The disadvantage of using raw color values(RGB) in image segmentation is that the program becomes very sensitive to changes in lighting/luminance. Hence, ROI’s under different lighting conditions, which usually happens, become difficult to segment.
In order to separate the color from the luminance, normalized chromaticity coordinates(rgb) are used. The following equations convert RGB to rgb:
Credits to Ma’am Jing Soriano for the formulas.
Note that b can be expressed as I – g – r, and hence it is dependent on r and g. Thus, knowledge of r and g is sufficient.
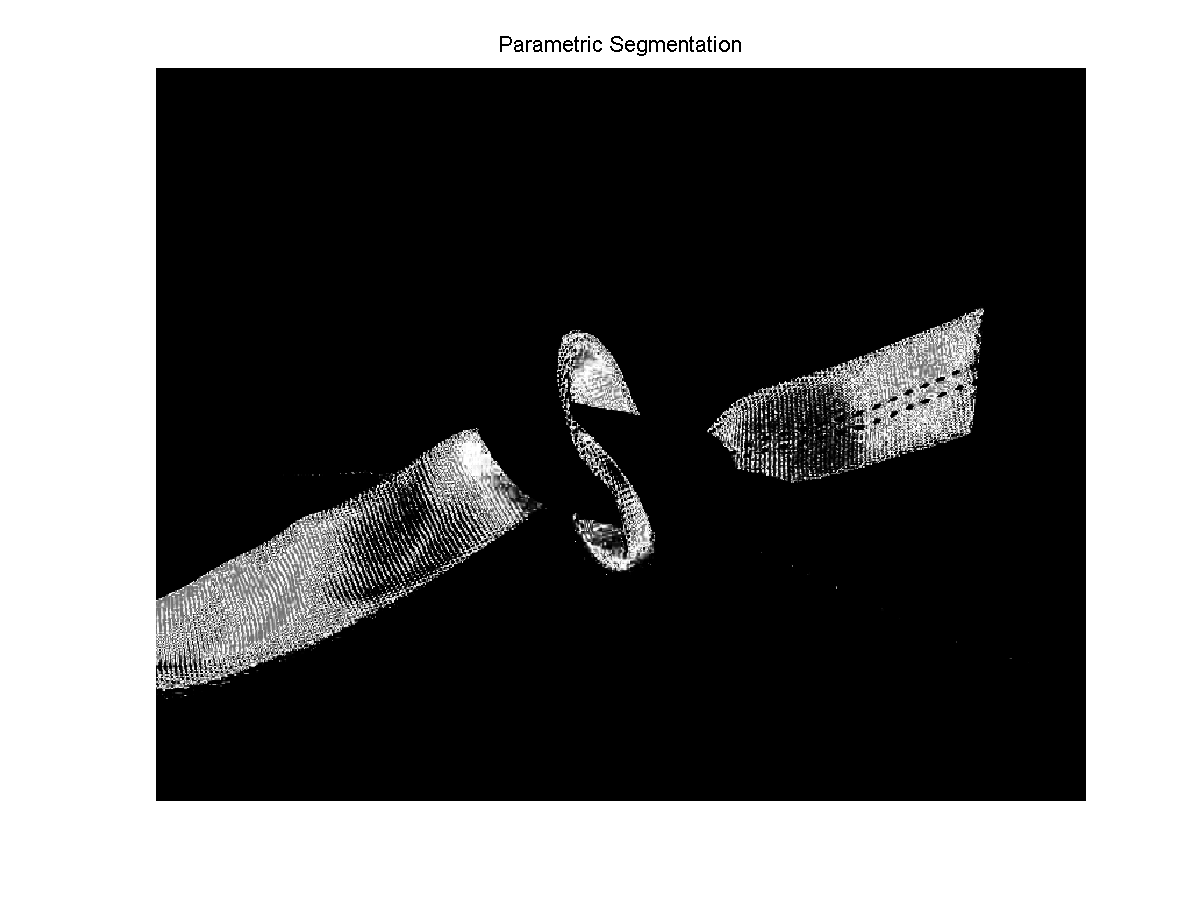
Parametric Segmentation
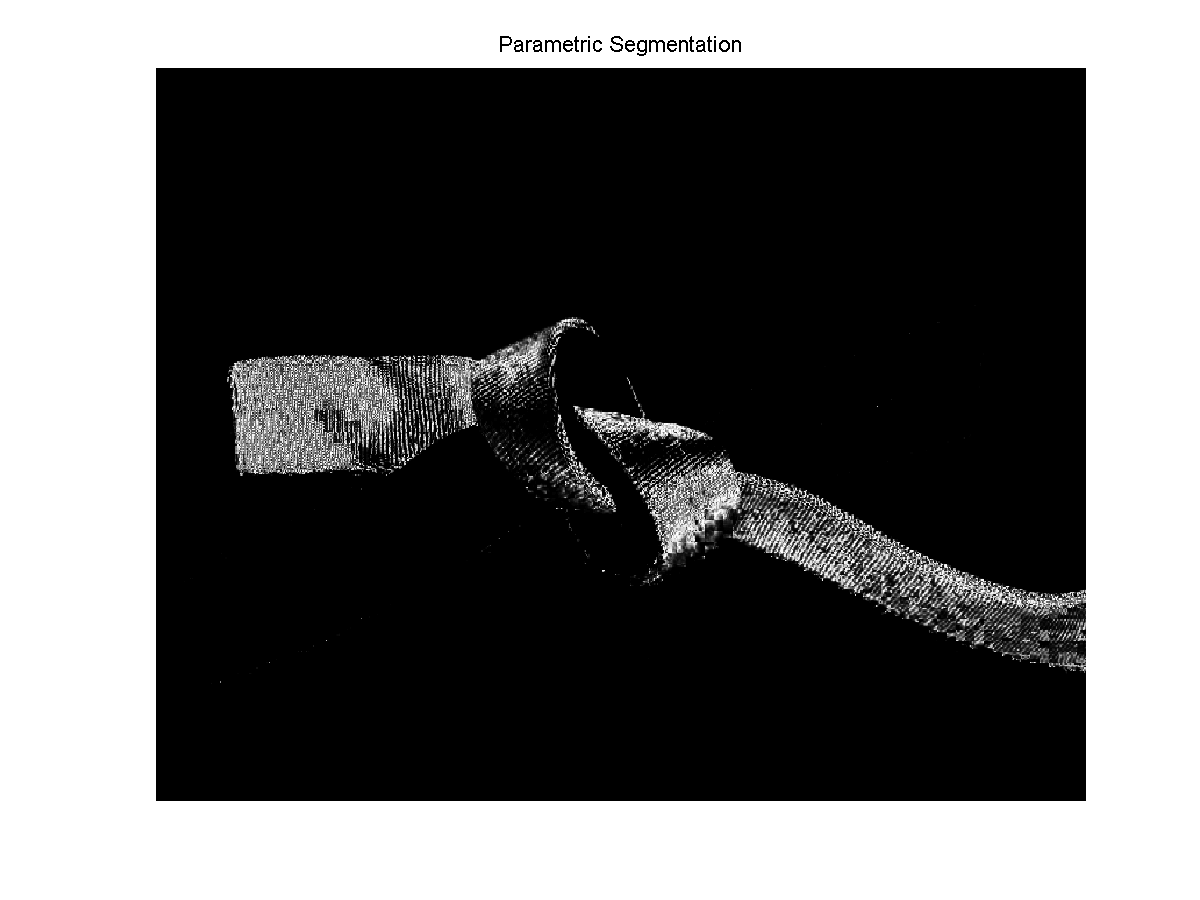
The first technique for image segmentation using histograms is called parametric segmentation, where gaussian curves are fitted to the histograms of the ROI in each of the r and g channels. The gaussian curves represent the probability that a pixel belongs to the ROI. In computer terms, the segmented image is obtained by getting, for each pixel, the probability that it belongs to the ROI, and replacing(backprojecting) that pixel value by this probability. Points with higher probability of belonging to the ROI appear brighter in the segmented image.
The result of using parametric segmentation to isolate the cyan(left) and red(right) colors can be found below. Notice that the results are relatively low contrast, signifying that there is more variation between data points, mainly due to the smooth and slow varying behavior of the gaussian curve fit. Bit depth is also better since no binning occurs since the gaussian curve is fit to the entire data set.
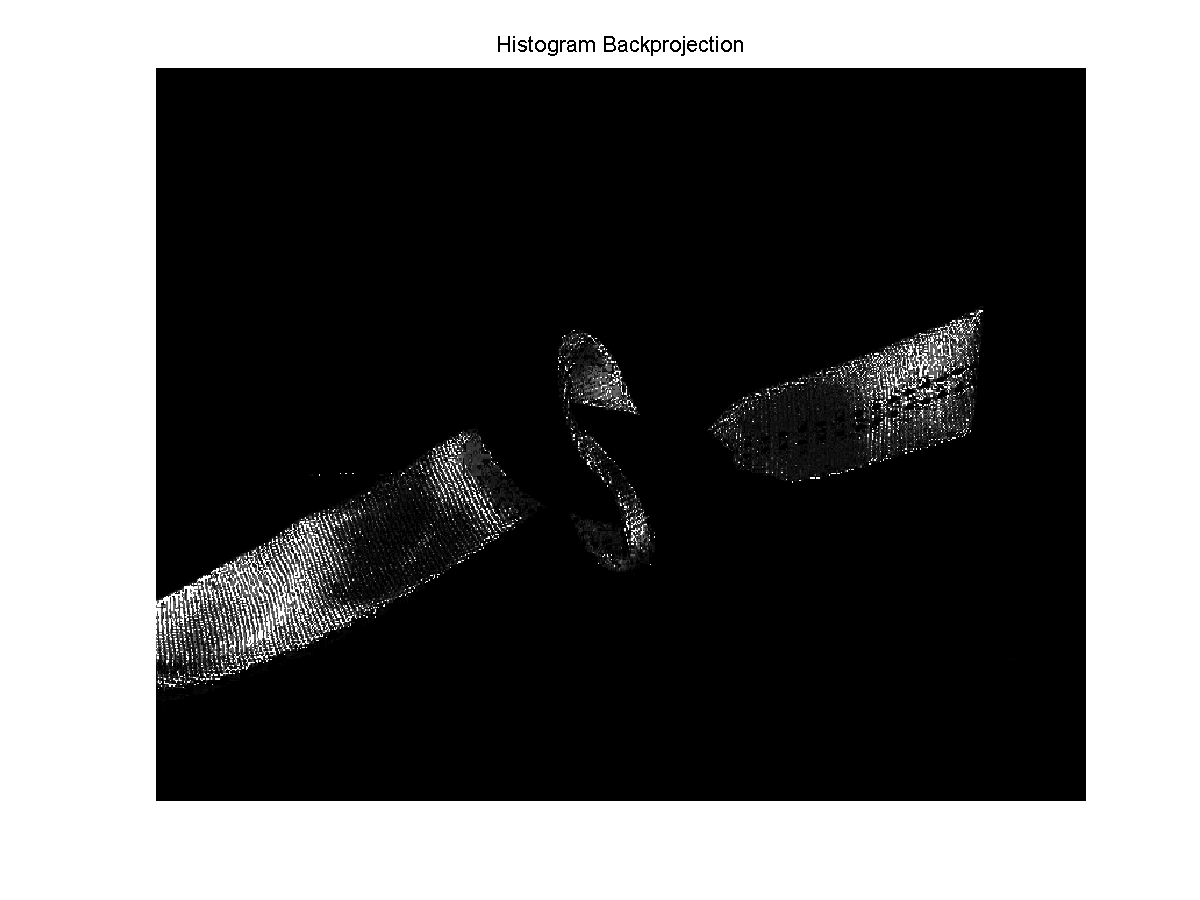
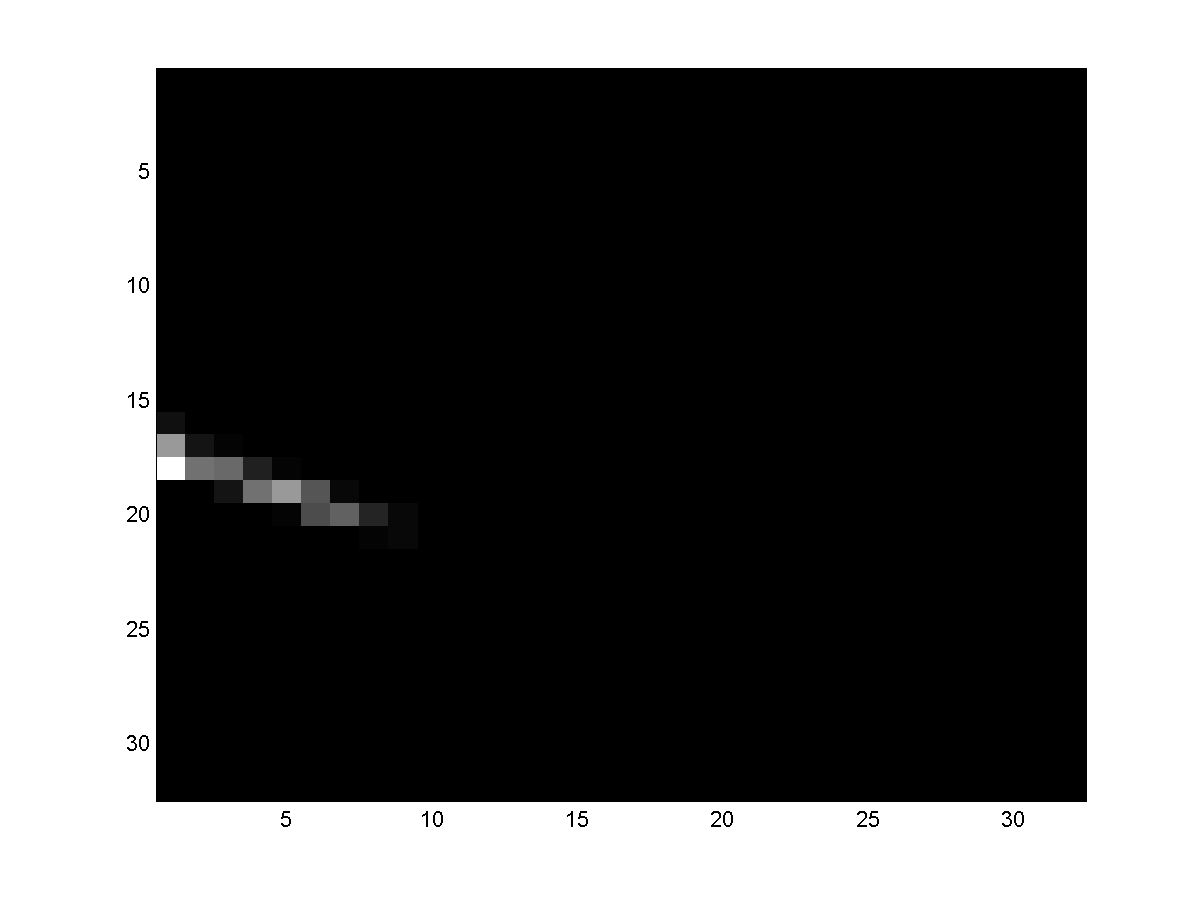
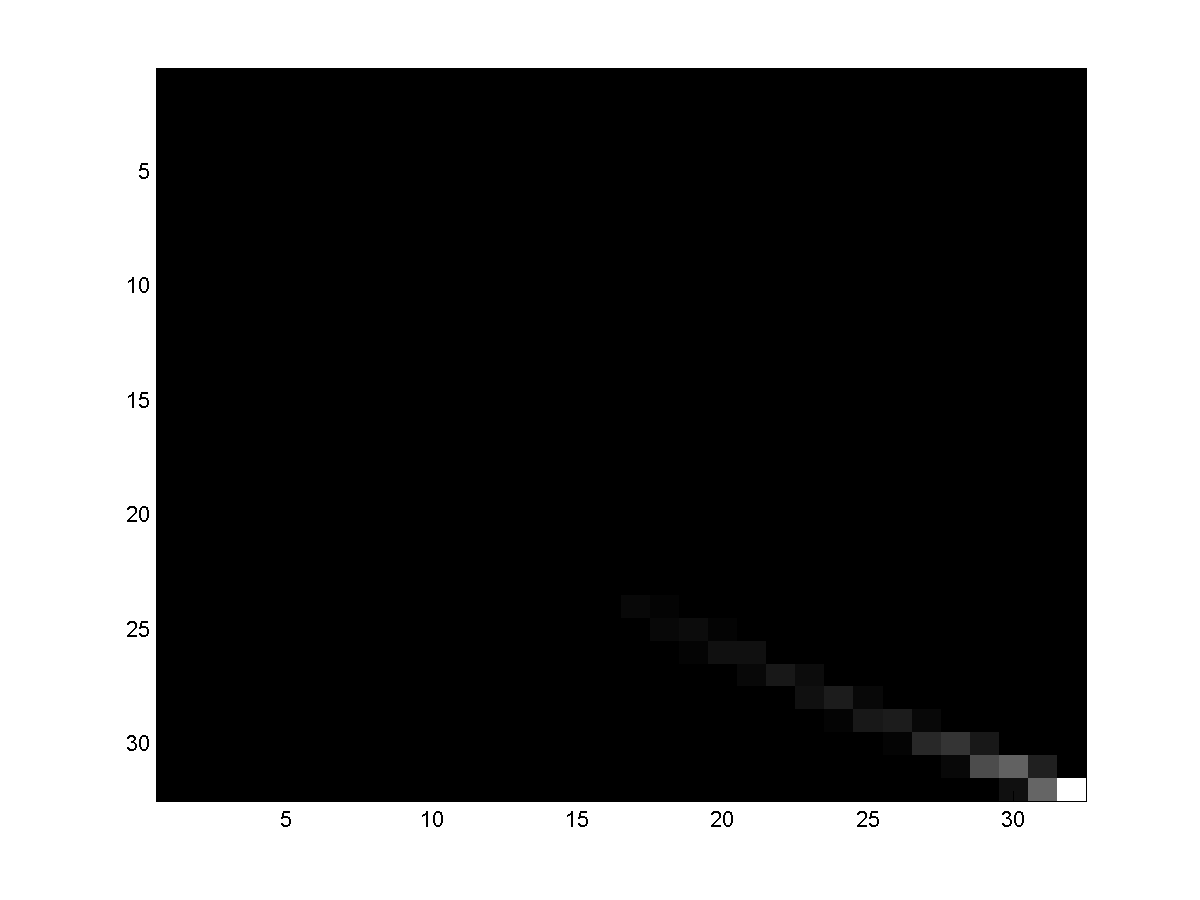
On the other hand, a similar technique to the one discussed above is called non-parametric segmentation or histogram backprojection. Instead of fitting a gaussian function, the actual value of the histogram is backprojected. That’s it. Sample histograms obtained for the cyan(left) and red(right) ROIs are shown. Note that upper left, lower left and lower right represent pure green, blue and red colors, respectively, while their centroid represents white. Hence, the histograms seem plausible, as cyan lies between green and blue, while the red ROI is isolated to the red corner.
Backprojecting these histogram values to the image results in:
Compared to parametric segmentation, histogram backprojection results in image of higher contrast. This entails better visual inspection, but note that this may also mean that the image is made up of primarily dark and bright portions, and little of the gray portions (due to the binning process of the histogram). However, since histogram backprojection uses the actual histogram values, and not an interpolation, the results are more true to the image.
Conclusion
In conclusion, parametric segmentation can segment images with better bit depth, due to the interpolating nature of the gaussian fit, while histogram backprojection produces higher contrast images due to the binning process.